Title
SNMP vs NetFlow in practice: a key enterprise customer complained about latency in Teams calls. SNMP confirmed the problem, and NetFlow found the root cause at another customer on the same router.
Situation
A key enterprise customer called the ISP's technical support about latency during Teams calls. The network administrator checked the router that served this customer along with hundreds of others, using latency data stored in Prometheus.
The latency graph showed a 10-minute anomaly that repeated every hour.
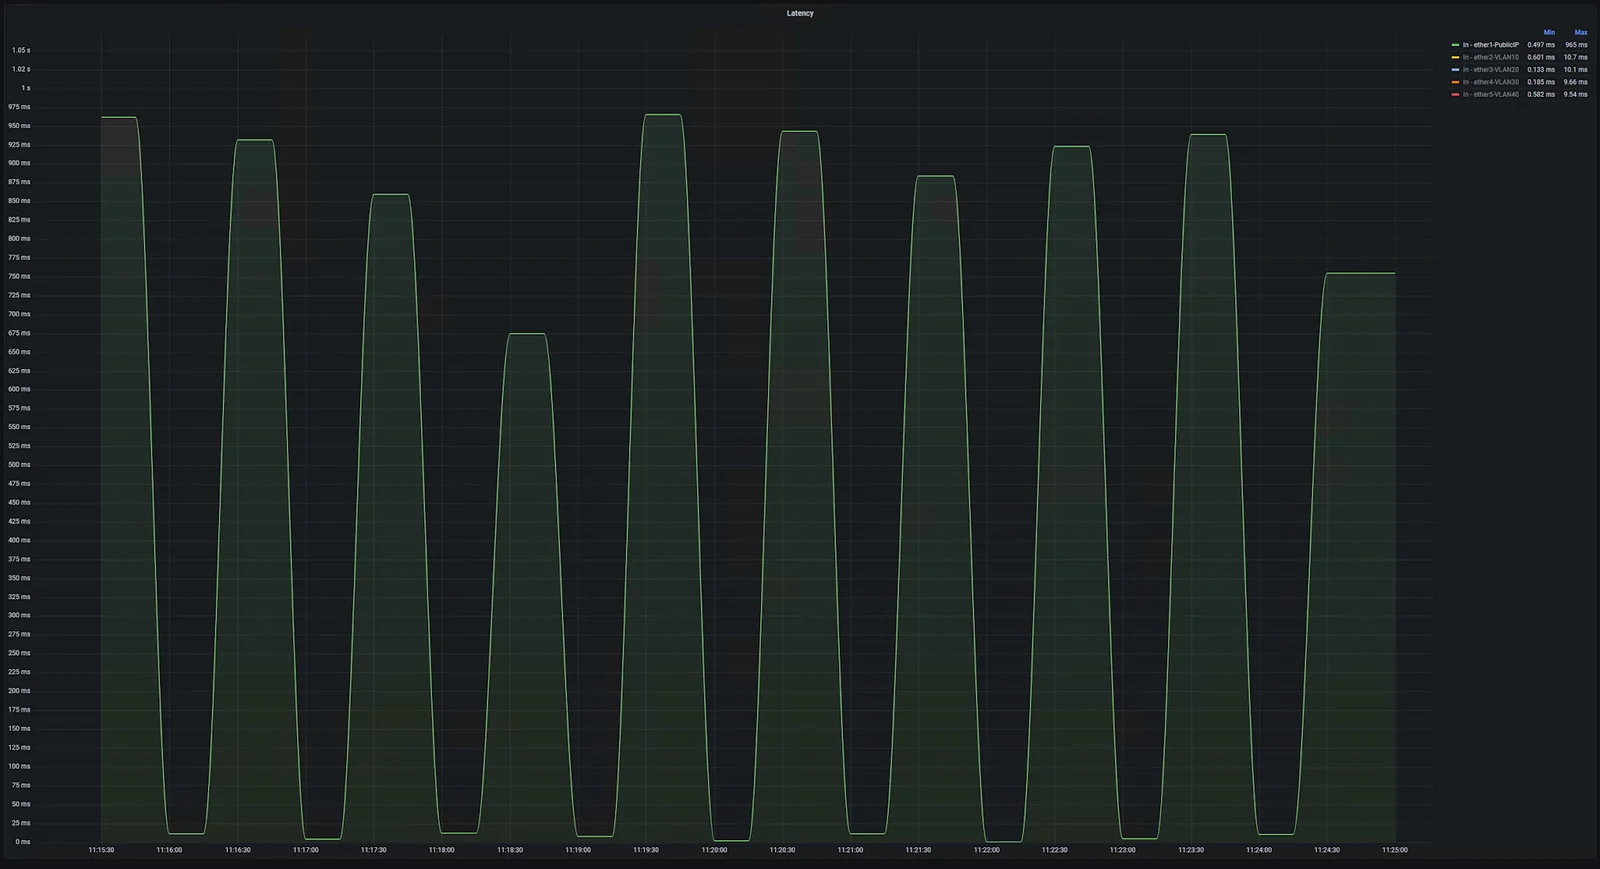
Dropped packets and CPU usage followed the same pattern, so the customer's complaint was real.

Challenge
SNMP telemetry showed that something was happening, but not what was causing it. That is the typical gap in SNMP vs NetFlow: SNMP shows load and errors on a device, not which traffic causes them.
Solution
The administrator turned to NetFlow:
- The ISP had NetFlow export on all core routers.
- Flows went continuously to a central FLOWCUTTER collector.
Fast drill-down in FLOWCUTTER led to the root cause. A periodic open ports scan set up in FLOWCUTTER helped confirm it.
Results
On the affected router, traffic went down while the number of talkers went up. Drill-down showed the anomaly was DNS related.
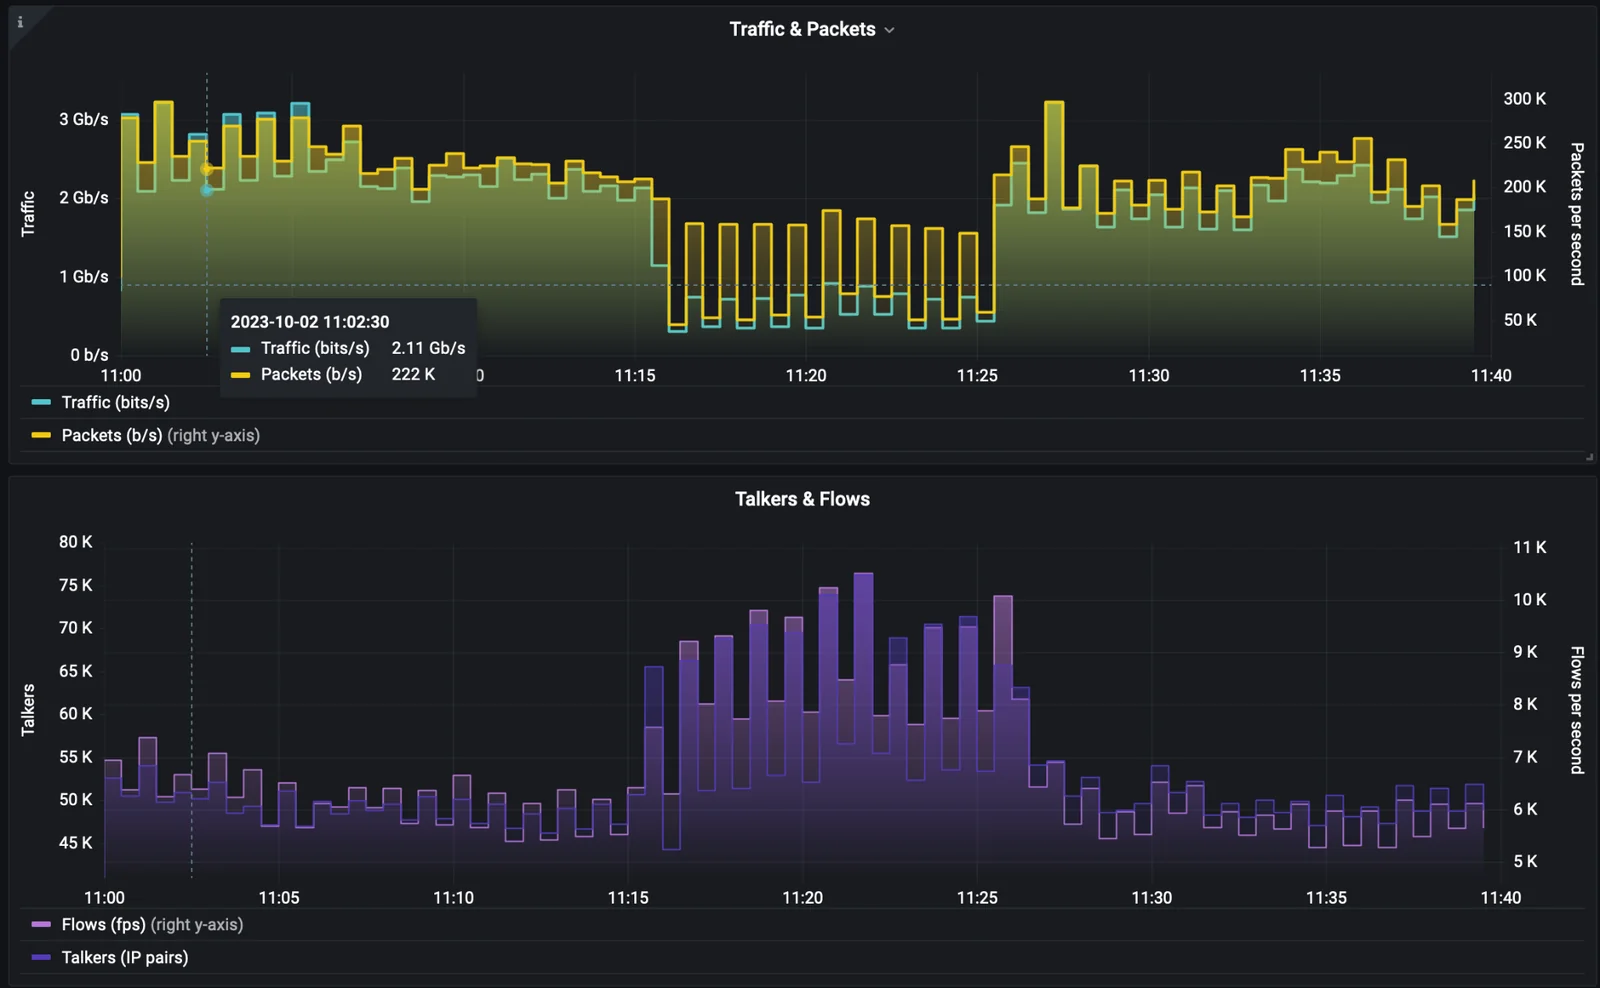
The open ports scan from the previous night showed that another customer with a public IP had opened the DNS port to the internet. The resulting traffic put extra load on the router and affected other customers in the same region.
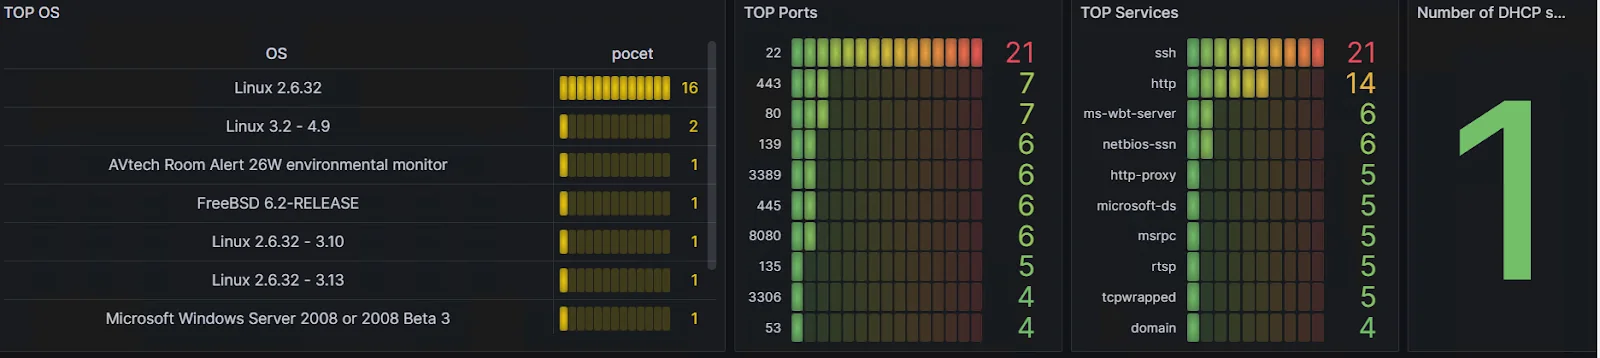
The ISP called that customer about the misconfiguration. Once the port was closed, the anomalies stopped and the enterprise customer's latency issues disappeared.
One weekend, we experienced service degradation in periodic intervals. We were not able to find the root cause from SNMP telemetry. FLOWCUTTER helped us identify a reflective amplification DDoS attack. On Monday, my network worked perfectly again.
Lukas Vacek, Viridium, regional ISP
Resources
- NetFlow analysis in Grafana
- Open ports scan
- SNMP vs flow telemetry
Takeaway
SNMP confirms that there is a problem. NetFlow shows where the traffic comes from and where it goes. Correlated with an open ports scan, it found a root cause SNMP alone would have missed and helped the ISP keep a key customer.