In short
SNMP tells you a link is full. Flow data tells you whether it's a DDoS attack, which method it uses, which customer is the target and where the traffic comes from. That's what DDoS detection at an ISP has to answer before you decide what to block.
In this guide: DDoS or busy link? · What each attack looks like · Attacks from your network · Why thresholds aren't enough · First checks after an alert · What ISPs do next · What flow data can't show
Is it a DDoS or just a busy link?
On an interface graph, a busy evening and an attack can look the same. In flow data, they don't. Signs of an attack:
- Most of the new traffic goes to one IP address, often a single customer.
- It comes from many sources at once, or from one IP range.
- One protocol or port dominates, for example UDP from source port 53.
- The number of talkers jumps, and nothing on your network explains it.
A legitimate spike can look similar, so the answer comes from who sends what to whom, not from volume alone.
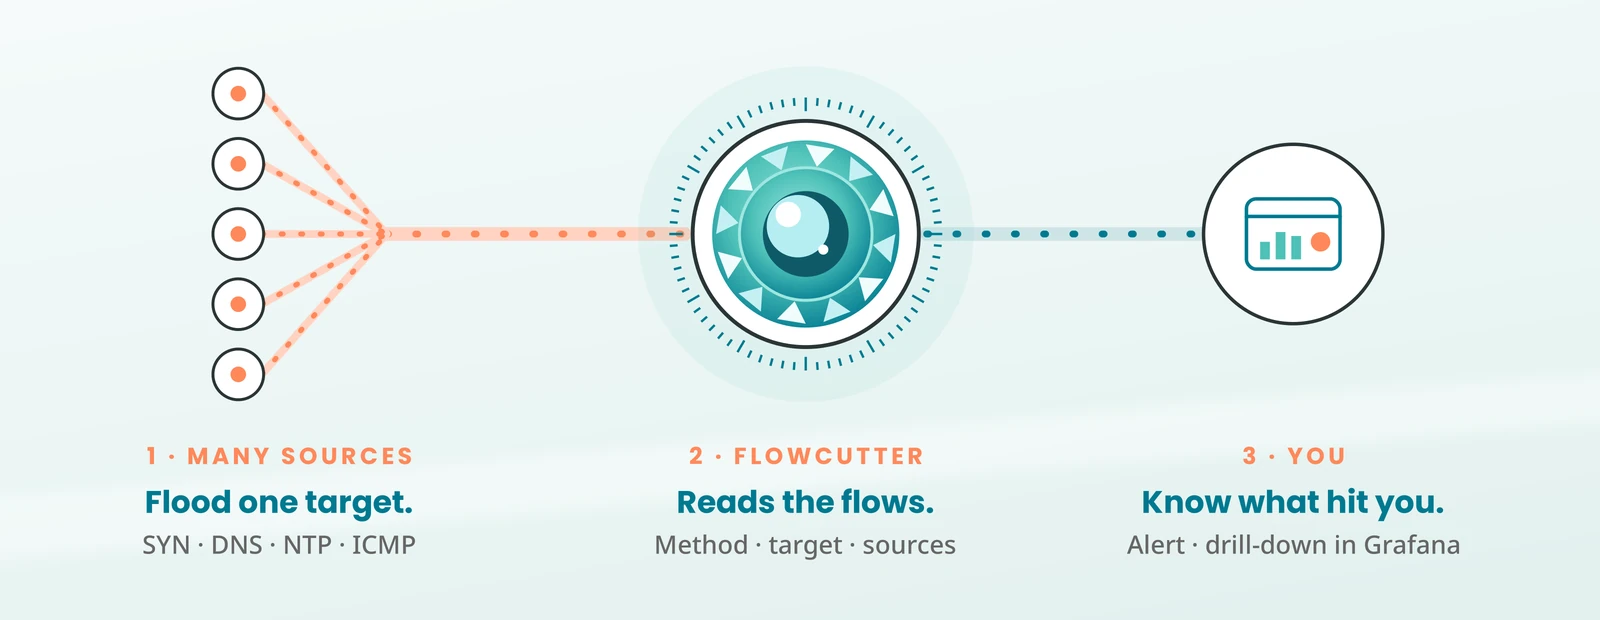
What does each attack type look like?
| Attack | What you see in flow data |
|---|---|
| SYN flood | Many TCP SYN packets to one target, from many source addresses |
| DNS amplification | Large UDP responses from source port 53 to one target |
| NTP amplification | UDP traffic from source port 123 to one target |
| SSDP amplification | UDP traffic from source port 1900 to one target |
| CLDAP amplification | UDP traffic from source port 389 to one target |
| Memcached amplification | UDP traffic from source port 11211 to one target |
| ICMP flood | A flood of ICMP packets to one target |
FLOWCUTTER has ready-made detection templates for SYN, SYN-ACK, ICMP, DNS and NTP floods.
What if the attack comes from your network?
A DDoS can also start inside your network. A customer device with DNS open to the internet can be abused to flood someone else, and your uplink fills with its responses. In flow data, you see upload driven by source port 53 and a sudden jump in talkers. Read how an outbound DDoS cut a town offline.
Why aren't thresholds enough for DDoS detection?
A fixed threshold fires on every busy evening, or misses an attack that stays just below it. Anomaly detection first learns how your network normally behaves, then compares traffic against that. It needs that learning phase before it can tell what's unusual for you.
What to check first after an alert
- Direction: is the traffic coming in, or leaving your network?
- Target: which IP, and which customer is behind it?
- Method: which protocol and ports dominate?
- Sources: many addresses, one range, or one of your own customers?
With these four answers you can choose the narrowest response that stops it.
What do ISPs do once they know?
Knowing the method, the target and the sources lets you choose a narrow response instead of a broad one. From real cases:
- A UK ISP faced 20 DDoS attacks in two days. Flow data showed the vector, and mitigation via upstream BGP ended the outages.
- Another ISP faced a distributed DDoS wave that slipped past scrubbing. Flow data let it cut each wave down until the attacks stopped.
- In the outbound case, the ISP filtered the exact port combination with BGP FlowSpec.
What can't flow data show?
Attacks that look like normal visits. An application-layer attack sends complete, valid requests to a website, often from many ordinary addresses. Flow data shows the connections, not the requests inside them, so you see more sessions to one server, but not what they ask for. That part is handled by the web server and its protection.
Where FLOWCUTTER fits
Monitoring shows there is a problem. FLOWCUTTER shows what changed.
FLOWCUTTER reads flow data from your routers and detects incoming floods and outgoing amplification via open DNS. Alerts go out by e-mail, Slack or webhook, and from the alert you click through to the IPs and ports behind it in Grafana. FLOWCUTTER finds and shows the attack; the response stays in your hands. More on the product page.
Related
- NetFlow, sFlow or IPFIX: which one should you export?
- What is a NetFlow collector?
- How UK ISP ended a 2-day DDoS attack
- How ISP outlasted a two-week DDoS wave
- How ISP got ahead of a SYN flood campaign
See it on your own traffic. 30 days. Your infrastructure. Your real traffic. Try FLOWCUTTER for 30 days