Outgoing DDoS (reflexive DNS)

Outgoing DDoS (reflexive DNS)

Title

How undetected DDoS cut town from internet

Outgoing DDoS stopped before making havoc by saturating uplink for the whole network segment

Who

Companies: Any network operator such as provider of internet, communication services, web hosting, etc.

Roles: Network administrator

Use case: Beneš @ DobruskaNet

Situation

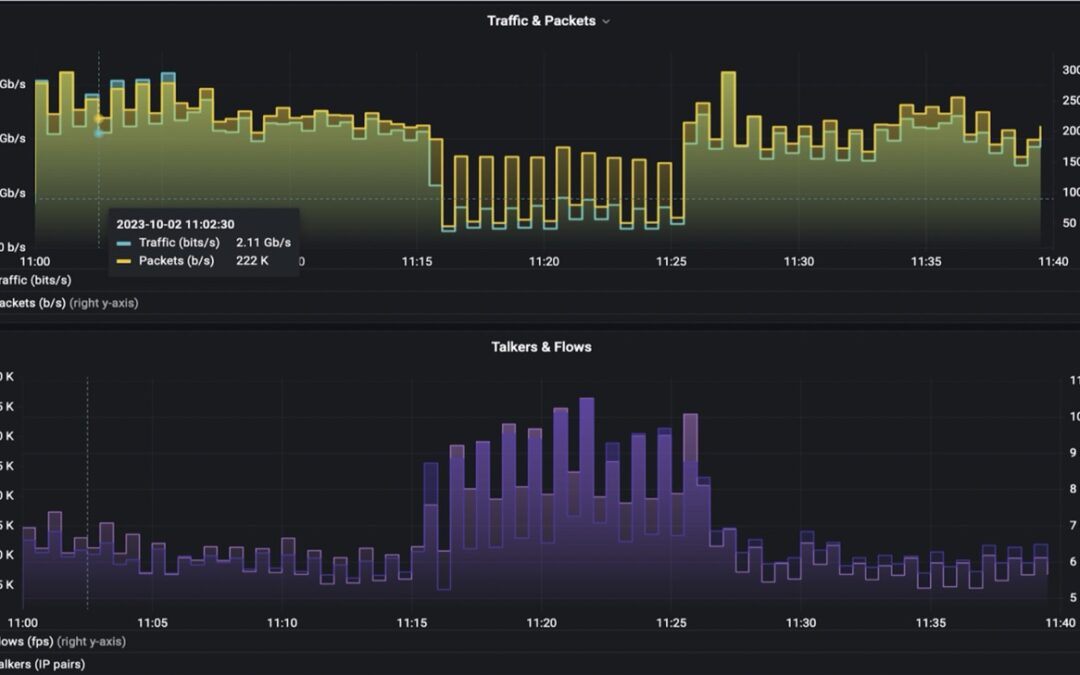
Network administrator was notified by an alert that one particular radio uplink becomes saturated in the middle of the day. This network segment represented a remote town. Consequently all homes and institutions in there experienced severe connection problems.

Challange

SNMP data showed the saturation of uplink in regular intervals. But nothing apparent was going on. Behind this link ISP didn’t have detailed information per customer, hence, the network administrator was able to find out whether there is one particular endpoint responsible for the upload.

What to do?

Solution

Network administrator analyzed anomaly using netflow data – traffic telemetry.

  • ISP had netflow export on the perimeter 
  • Netflow was stored in the central collector with FLOWCUTTER software.
  • With FLOWCUTTER, any admin can easily do a fast drill-down analysis of netflow and other data sources.
  • In addition, FLOWCUTTER allows to set up “out of the box” detection of various volumetric DDoS attacks

That helped identify the nature of the DDoS attack and revealed information used to effectively mitigate it.

    Results

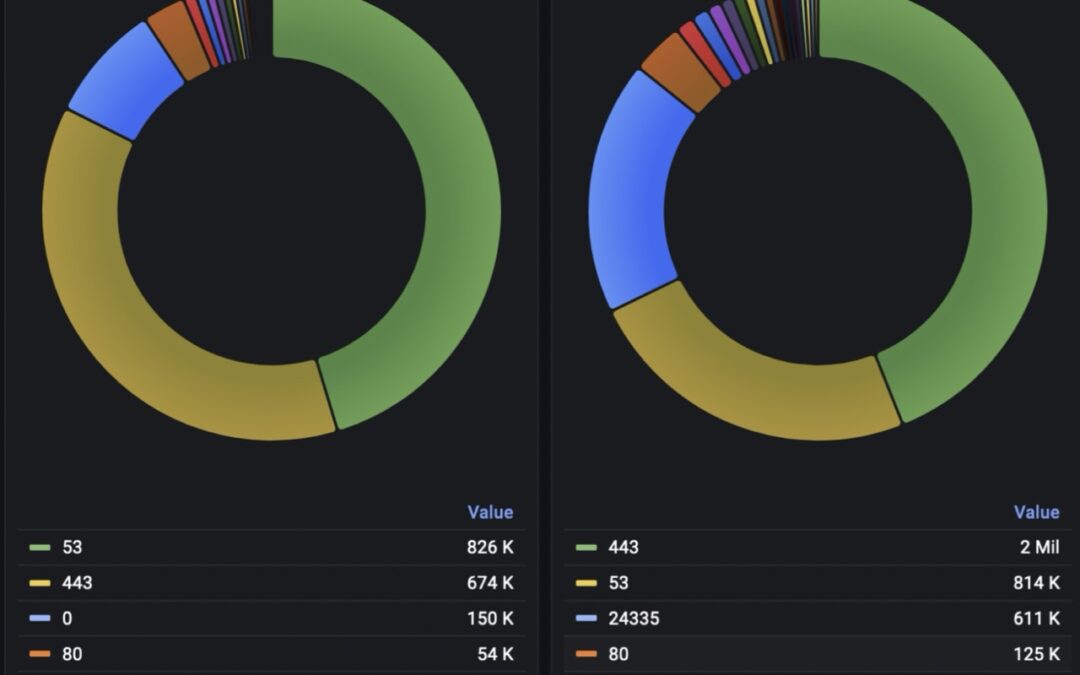
    The traffic analysis in FLOWCUTTER showed the nature of the anomaly. By plotting Top N source ports by number of flows, the administrator correctly identified that responses to DNS queries were contributing most to the uplink saturation. Incoming DNS packets stayed hidden in the overall volume of traffic, but the outgoing DNS responses were clearly visible.

      Focusing on just DNS responses meant easy operation (filtering src.port=53 only) that took only 2 seconds. This is where FLOWCUTTER excels above all competitive solutions.

      The next step was to compare behavior before and during the anomaly. It showed that normally there were 1.000 talkers, but suddenly raised to 23.000 corresponding to the distributed nature of the attack.

      Even though the administrator wasn’t able to find a particular end customer responsible, because there were many customers hidden behind each public IPv4 address, he identified this reflexive DDoS using DNS. 

      Moreover, analysis revealed information (combination of Src/Dest. ports = 53/24335) that he could use to mitigate the attack using BGP FlowSpec (RFC 5575). Use of FlowSpec is similar to BGP Remotely trigger black hole, but it provides more granular control (ports, packet length, TCP flags, ICMP code, …) and shape these flows. 

      Resources

      • Netflow analysis in Grafana
      • Open ports scan
      • SNMP vs Flow telemetry

      Takeaway

      ISP detected uplink saturation.

      1. Within netflow, the administrator find root cause in outgoing reflexive DDoS attack using DNS.
      2. He was able to mitigate attack using BGP FlowSpec


      For the future, ISP used FLOWCUTTER’s ability to monitor and alert on traffic anomalies – admin can set up “out of the box” detection of various volumetric DDoS attacks. And next time be alerted even faster.

        Revolutionize your Netflow analysis with FLOWCUTTER

        Discover the hidden phenomena in your big data and master the Grafana environment. Try the demo and subscribe to our newsletter for the latest updates on netflow and anomaly detection.
        FLOWCUTTER
        TOOL “TO YOUR IMAGE”
        Netflow vs SNMP (latency)

        Netflow vs SNMP (latency)

        Title

        With SNMP only, ISP would lose key customer

        An anomaly that SNMP monitoring couldn’t spot but flow-based analysis revealed root cause and helped ISP to retain key enterprise customer

        Who

        Companies: Any network operator such as provider of internet, communication services, web hosting, etc.

        Roles: Network administrator

        Use case: Beneš @ DobruskaNet

        Situation

        A key enterprise customer called ISP’s technical support complaining about latency issues when using Teams. The network administrator checked the router where the customer is connected together with hundreds of other customers. He analyzed latency data stored in Prometheus.

        Screenshot: latency on 30s intervals on router

        The latency graph revealed a periodicity of an anomaly that took 10 minutes. This repeated every hour.

        As well, packets dropped, and cpu usage revealed a similar trend.

        Challange

        However, based on SNMP telemetry, the administrator wasn’t able to find out the root cause of an issue.

        What to do now?

        Situation

        Network administrator looked into netflow data – traffic telemetry (link).

        • ISP had netflow export in place on all CORE routers
        • Netflow data streams were continually sent to the central collector with FLOWCUTTER software.

        With help of FLOWCUTTER’s ability to easily perform a fast drill-down analysis of flow dataset, the administrator was able to find the root cause of an issue.

        In addition to netflow data, periodical scan of open ports was set up in FLOWCUTTER. That helped to expose the first root cause of the anomaly.

          Results

          On the target router, there was an anomaly – traffic went down while talkers went up.

            Drill-down analysis revealed that the anomaly is DNS related.

            After that, the administrator checked the dashboard with results from the open ports scan from the previous night. It showed that another customer with public IP opened the DNS port to the public. That led to additional stress for the router influencing other customers in the same region.

            There are more examples of what can be revealed within seconds about the customer:

            • Upload/download
            • Ports and protocols related to specific services: ftp, telnet, ssh
            • IP is blacklisted
            • Communication w/ botnet 
            • Open ports and vulnerabilities visible from outside

            Resources

            • Netflow analysis in Grafana
            • Open ports scan
            • SNMP vs Flow telemetry

            Takeaway

            1. There are many root causes that cannot be revealed by analyzing SNMP-like telemetry. That’s where netflow data comes in handy. It helps by providing deeper insight into the source and destination of each traffic flow.
            2. In addition to SNMP and Netflow, it’s useful to correlate with other data sources – in this case open ports scan.

            ISP resolved the issue with ease. 

            The second customer, where the root cause dwelled, was called, pointing to misconfiguration. The port was closed, anomalies stopped.

            For the key enterprise customer, the latency issue was resolved helping ensure a good relationship.

            Revolutionize your Netflow analysis with FLOWCUTTER

            Discover the hidden phenomena in your big data and master the Grafana environment. Try the demo and subscribe to our newsletter for the latest updates on netflow and anomaly detection.
            FLOWCUTTER
            TOOL “TO YOUR IMAGE”